SPARQL Queries: JJKB on Wikidata
As part of our research, we investigated approaches and designs for using data visualization based on the data our team has collected about the exhibition and art work case studies that are discussed here on the Joan Jonas Knowledge Base. We have uploaded these data into Wikidata and provided the following data visualizations for our readers. We hope that these graphical representations of the data and the variety of formats will encourage further research on Joan Jonas’s work as well as inspire cultural heritage research using linked open data with contemporary art in general and performance based art practices in particular. To this end, we have also provided additional pages that explain how these data were managed and uploaded as well an introduction to writing SPARQL queries to obtain the results that you see below and a video tutorial.
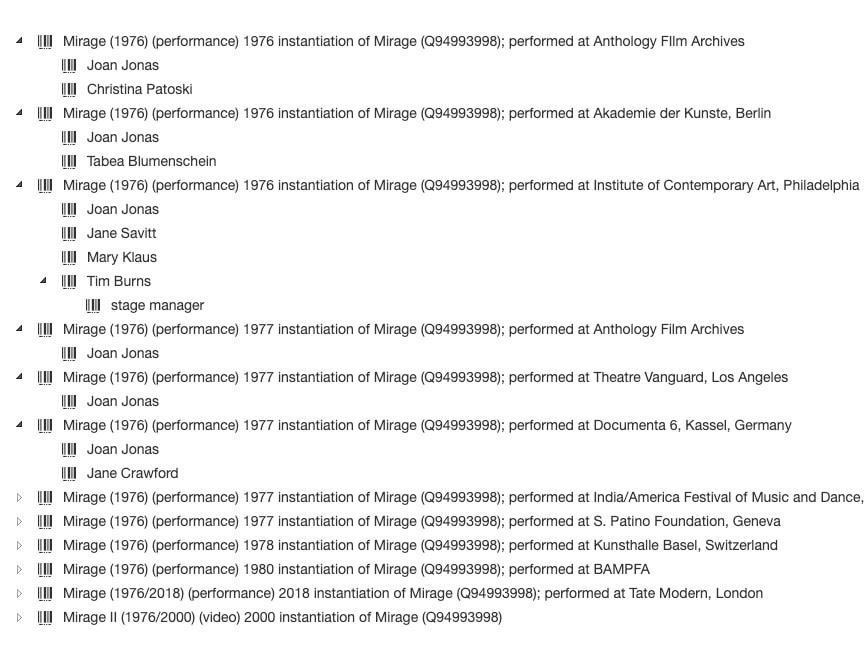
Collaborators and performers and their relationships to Mirage and Organic Honey using a UNION query
“Tree” data visualization example.
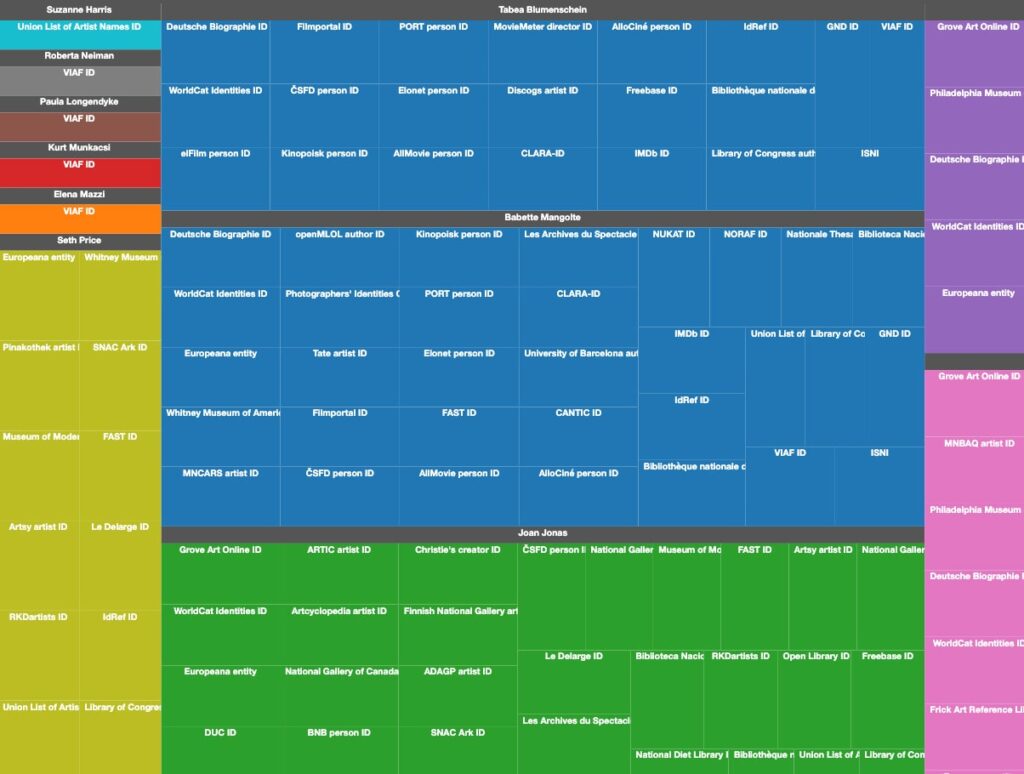
Collaborators on Mirage and Organic Honey who are represented in the linked open data cloud beyond Wikidata
“Treemap” data visualization example.
All instantiations of Mirage showing location and performers
“Dimensions” data visualization example
All instantiations of Organic Honey showing location – contributors – and their roles
“Dimensions” data visualization example
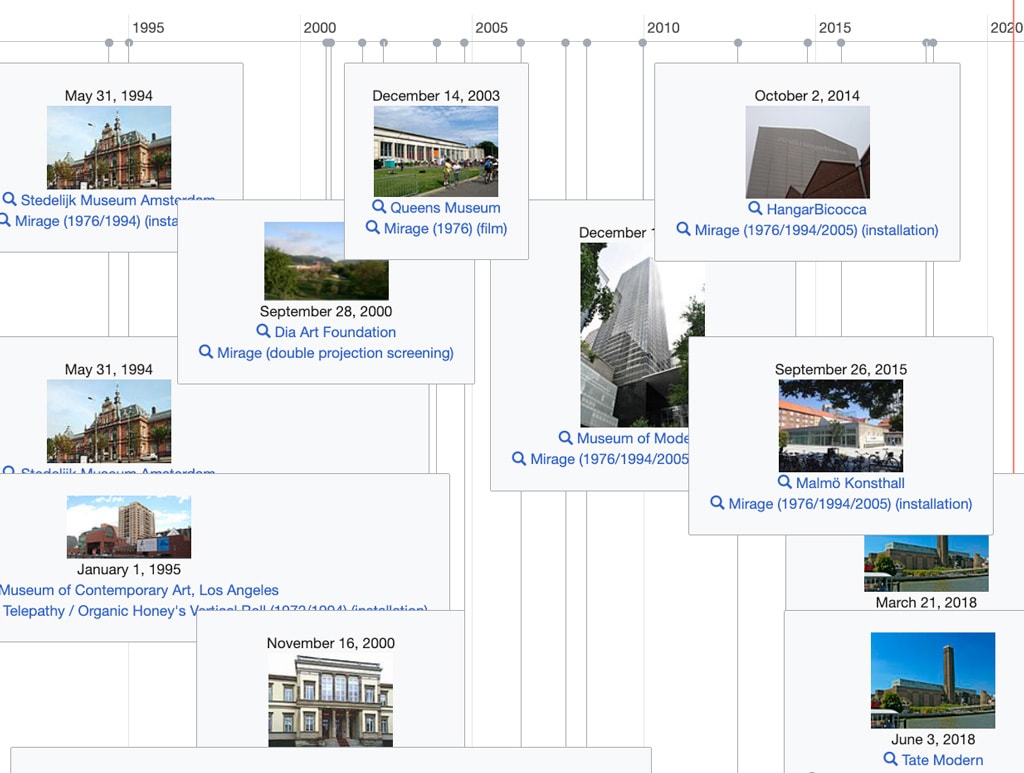
All instantiations of Mirage and Organic Honey with location (image) and date(s)
“Timeline” data visualization example.
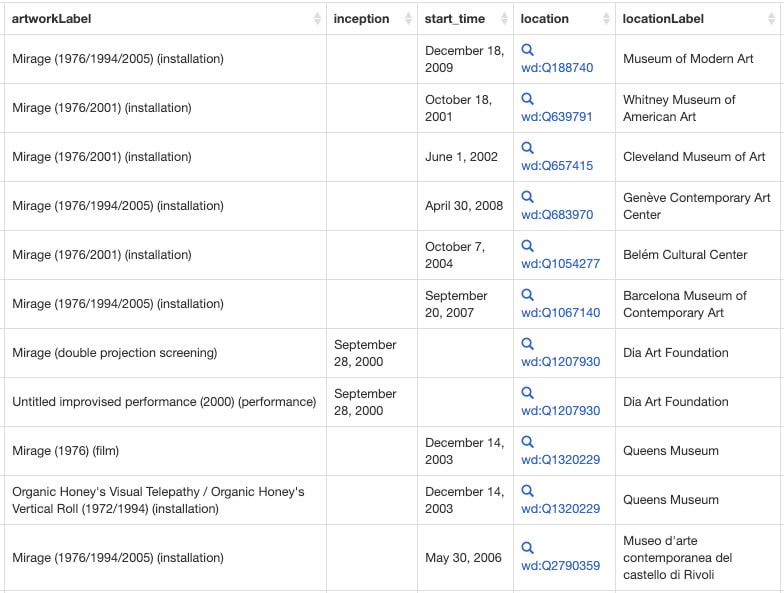
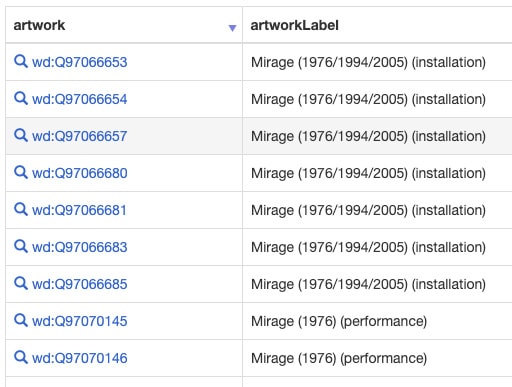
All instantiations of Mirage and Organic Honey in a time range (2000-2010)
“Table” data visualization example.
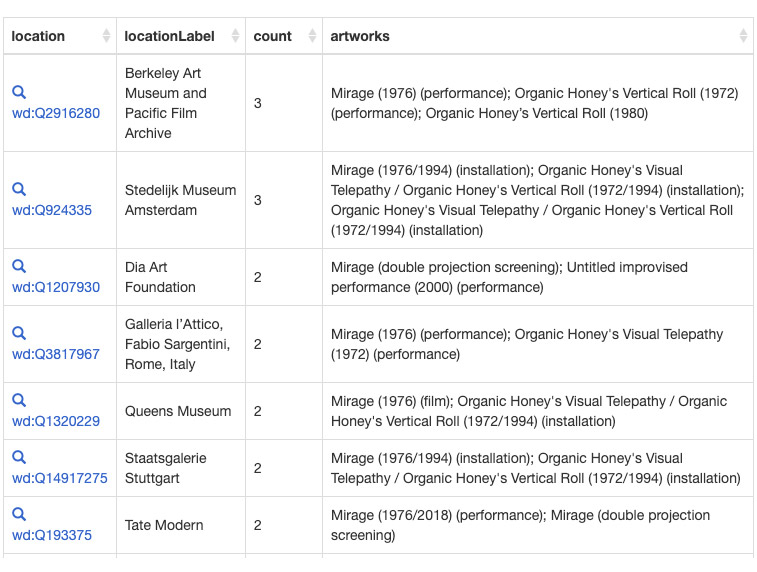
All instantiations of Mirage and Organic Honey with location (image) and total number of works for each location.
“Table” data visualization example.
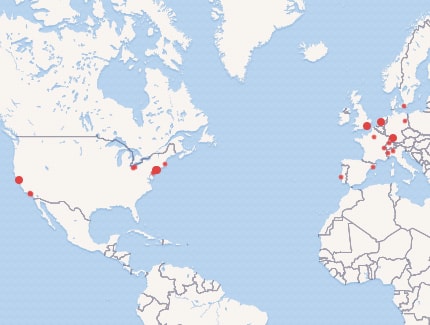
All instantiations of Mirage and Organic Honey with locations
“Map” data visualization example.
All instantiations of Mirage with locations
“Map” data visualization example.
All instantiations of Organic Honey with locations
“Map” data visualization example.
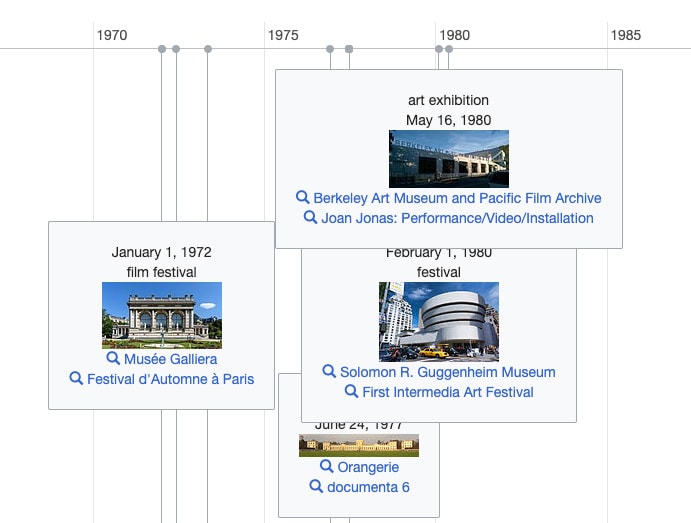
All exhibitions/festivals described by JJKB for Mirage and Organic Honey with location (image) and date(s)
“Timeline” data visualization example.
All instantiations of Mirage including parts (i.e. other artworks)
“Bar chart” data visualization example.
All instantiations of Organic Honey including parts (i.e. other artworks)
“Bar chart” data visualization example.
All instantiations of Mirage including materials used
“Graph” data visualization example.
All instantiations of Organic Honey including materials used
“Graph” data visualization example.
All instantiations of Mirage and Organic Honey which feature masks
“Table” data visualization example.
All instantiations of Mirage and Organic Honey floorplans (with links)
“Table” data visualization example.
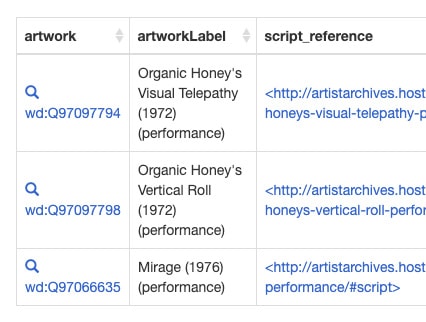
All instantiations of Mirage and Organic Honey scripts (with links)
“Table” data visualization example.
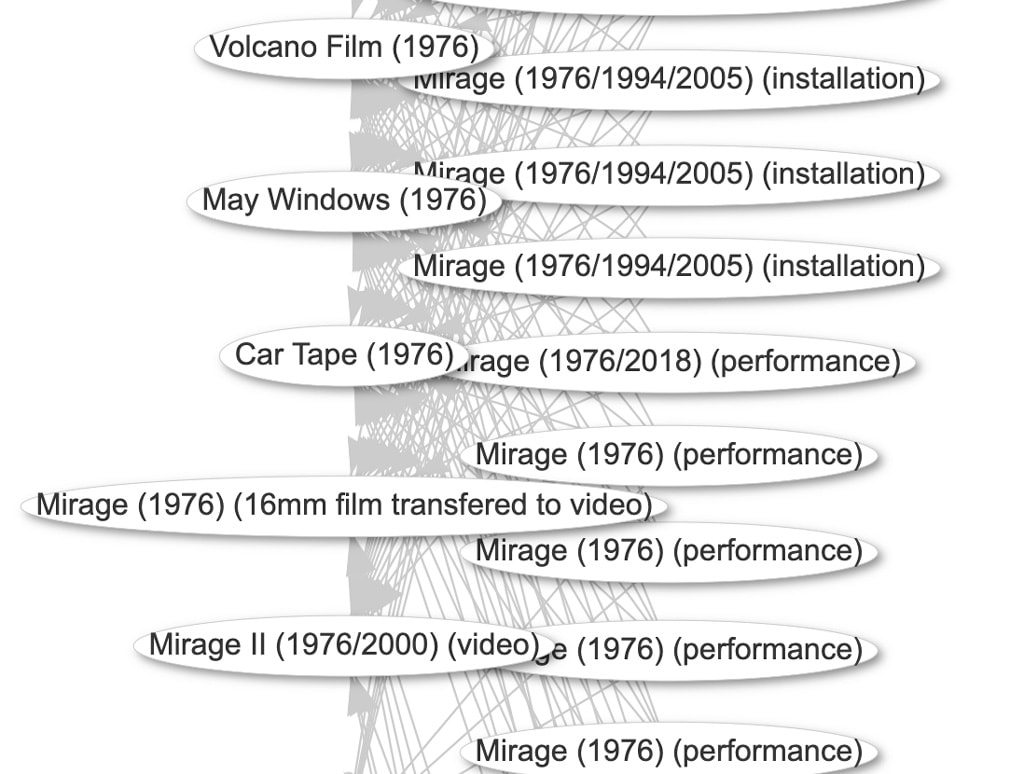
All video works that are parts of other works
“Graph” data visualization example.
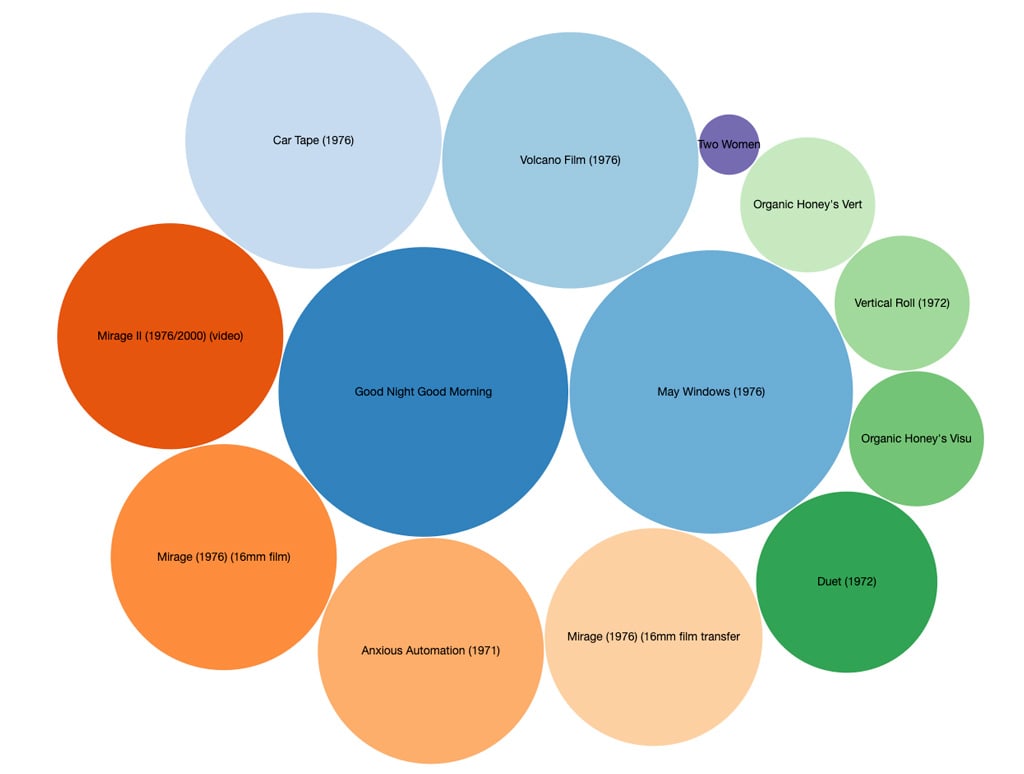
All video works that are parts of other works
“Bubble chart” data visualization example.
Previous section:
Introduction to LOD
Next section:
Workflow: Working with Cultural Heritage Datasets
